


Key Performance Indicators (KPIs) evolve from a well thought out Business Plan. The business plan should identify the key tasks which need to be effectively implemented to provide an opportunity to be successful. These Key Success Factors then need to be translated into the performance indicators that in turn need to be associated with all areas of the business using global ERP solutions so that the company is consistently operating in lockstep towards the same goals.
The key performance indicators need to be able to digest raw sets of values, which can be fed to global ERP solutions and similar systems that aggregate the data and product the indicators. There are two major types of KPI categories. The Quantitative which presents a specific value with targeted goals. These can be set up on an ERP software solution, such as the Oneir Solutions ERP Software, so that progress can be monitored against the KPI targets.
Qualitative values based on perceptions, tastes, or opinions are more difficult to interpret and measure. However, there are tools, such as the “Net Promoter Score” which asks the interested parties to rate the KPI on a scale of 0 to 10. For example, the question could be asked “How likely are you to recommend this company’s products or services to a friend or colleague?” Based on the rating, customers are then classified into three categories: detractors, passive and promoters. Scores of 6 or lower are “detractors”, “passives” are scored with 7 or 8 while “promoters” give a ranking of 9 and 10. General satisfaction indicators could also use a similar satisfaction ranking that allows the team to be evaluated.
In order to keep management and their staff focused on the KPIs, there needs to be ongoing reinforcement of the goals. Today, many global ERP solutions include dashboards that provide at-a-glance views of KPIs relevant to a particular manager and their staff. The “dashboard” is often displayed on a web page which is linked to a database that allows the report to be constantly updated. The Dashboard in turn appears on everyone’s computer, tablet and smart phone needs to provide the current status with regard to the company KPIs. This is the “progress report” or “report card” for the particular KPI. Depending on the responsibility of the individual using the dash board, there can be varied data and information displayed.
As with all report cards, there are successes and failures. It goes without saying, the successes need to be celebrated and their department’s staff praised and rewarded. However, when targets are not being achiever, an assessment process needs to be invoked to examine opportunities to improve critical performance. This review needs to involve all interested parties and may also take into consideration external input.
Since there is a need to understand well what is important, various techniques to assess the present state of the business, and its key activities, are associated with the selection of performance indicators. These assessments often lead to the identification of potential improvements, so performance indicators are routinely associated with ongoing ‘performance improvement’ initiatives. Keeping these KPIs up to date should effectively maintain a focused direction for the company’s growth.
Key Performance Indicators for Various Departments
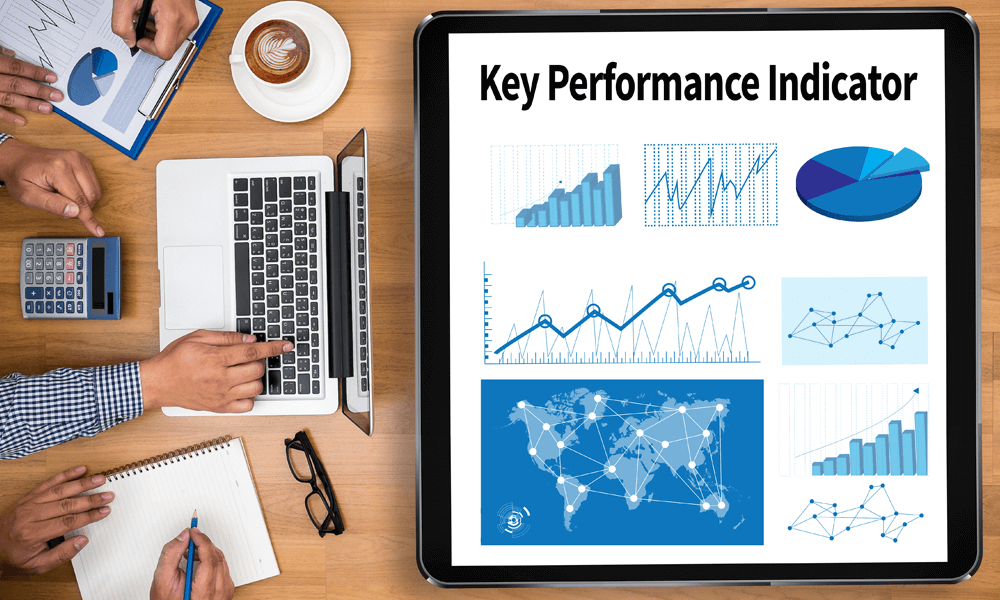
The company’s performance indicator or key performance indicator (KPI) is a type of performance measurement. They define a set of values against which to measure, and they can be tracked independently using global ERP solutions. KPIs evaluate the success of an organization or of a particular activity (such as projects, programs, products and other initiatives) in which it engages.
Marketing and Sales
Some examples are:
- New customer acquisition
- Demographic analysis of individuals (potential customers) applying to become customers, and the levels of approval, rejections, and pending numbers
- Status of existing customers
- Customer attrition
- Turnover (i.e., revenue) generated by segments of the customer population
- Outstanding balances held by segments of customers and terms of payment
- Collection of bad debts within customer relationships
- Profitability of customers by demographic segments and segmentation of customers by profitability
Many of these customer KPIs are developed and managed with customer relationship management software.
Faster availability of data is a competitive issue for most organizations. For example, businesses which have higher operational/credit risk (involving for example credit cards or wealth management) may want weekly or even daily availability of KPI analysis, facilitated by appropriate IT systems and tools.
Manufacturing
Overall equipment effectiveness is a set of broadly accepted non-financial metrics which reflect manufacturing success.
- OEE= availability x performance x quality
- Availability= run time / total time, by definition this is the percentage of the actual amount of production time the machine is running to the production time the machine is available.
- Performance= total count / target counter, by definition this is the percentage of total parts produced on the machine to the production rate of machine.
- Quality= good count / total count, by definition, this is the percentage of good parts out of the total parts produced on the machine.
- Cycle time ratio(CTR) = standard cycle time / real cycle time
- Utilization
- Rejection rate

Professional Services
Most professional services firms (for example: management consultancies, systems integration firms, or digital marketing agencies) use three key performance indicators to track the health of their businesses. They typically use professional services automation (PSA) software to keep track of and manage these metrics.
- Utilization rate= the percentage of time employees spend generating revenue
- Project profitability= the difference between revenue generated by a project and the cost of delivering the work
- Project success rate= the percentage of projects delivered on time and under budget
System Operations
- Availability / uptime
- Mean time between failure
- Mean time to repair
- Unplanned availability
- Average time to repair
Project Execution
- Earned value
- Estimate to complete
- Manpower spent / month
- Money spent / month
- Planned spend / month
- Planned manpower / month
- Average time to delivery
- Tasks / staff
- Project overhead / ROI
- Planned delivery date vs actual delivery date
Supply Chain Management
Businesses can utilize KPIs monitored in global ERP solutions to establish and monitor progress toward a variety of goals, including lean manufacturing objectives, minority business enterprise and diversity spending, environmental “green” initiatives, cost avoidance programs and low-cost country sourcing targets.
Any business, regardless of size, can better manage supplier performance with the help of KPIs robust capabilities, which include:
- Automated entry and approval functions
- On-demand, real-time scorecard measures
- Rework on procured inventory
- Single data repository to eliminate inefficiencies and maintain consistency
- Advanced workflow approval process to ensure consistent procedures
- Flexible data-input modes and real-time graphical performance displays
- Customer order waiting time
Main SCM KPIs will detail the following processes:
- Sales forecasts
- Inventory
- Procurement and suppliers
- Warehousing
- Transportation
- Reverse logistics
Suppliers can implement KPIs to gain an advantage over the competition. Suppliers have instant access to a user-friendly portal for submitting standardized cost savings templates. Suppliers and their customers use global ERP solutions to exchange vital supply chain performance data while gaining visibility to the exact status of cost improvement projects and cost savings documentation.
To learn more about how global erp solutions can benefit your business, contact our team at Oneir Solutions today.
